The short version
- RICE is reach times impact times confidence, divided by effort.
- Every input shown, on twenty real requests, so the scores can be checked rather than believed.
- Reach dominates, because it's the only unbounded input.
- Two requests score within a point of each other and aren't remotely the same decision.
RICE prioritisation is reach times impact times confidence, divided by effort. Most examples show the formula and three rows. This one shows twenty, with every input, and then the part nobody prints, which is what happens when two scores come out close enough that the ordering between them is noise.
What is the RICE formula?
(Reach × Impact × Confidence) ÷ Effort.
- Reach. How many users in a period. Users per quarter here.
- Impact. How much it matters to each of them, on a fixed scale. 0.25 for minimal, 0.5 low, 1 medium, 2 high, 3 massive.
- Confidence. How much you believe the first three numbers, from 0 to 1.
- Effort. Person months.
The output is a score with no units. It's only meaningful against other scores from the same list, which is worth remembering when somebody quotes a RICE score across two teams.
There's a queue with effort estimates on it if you want to see where those inputs live, and the demo is open without an account.
Doing this in a tool rather than a spreadsheet? Twenty one feature request tools and the eight units they bill on. The unit decides the bill, not the headline price.
The twenty requests, with every input
| Request | Reach | Impact | Confidence | Effort | RICE |
|---|---|---|---|---|---|
| Tag colours | 500 | 0.25 | 1.0 | 0.25 | 500 |
| CSV export of the weekly report | 120 | 2.0 | 0.9 | 0.5 | 432 |
| Slack notifications | 400 | 1.0 | 0.9 | 1.0 | 360 |
| Saved filters | 180 | 1.0 | 0.9 | 0.5 | 324 |
| Weekly digest email | 300 | 1.0 | 0.9 | 1.0 | 270 |
| Bulk status changes | 90 | 1.5 | 1.0 | 0.5 | 270 |
| Dark mode | 900 | 0.25 | 1.0 | 1.0 | 225 |
| Merge duplicate requests | 110 | 2.0 | 1.0 | 1.0 | 220 |
| Mobile layout for the board | 700 | 0.5 | 0.9 | 2.0 | 158 |
| Webhook on status change | 40 | 2.0 | 0.9 | 0.5 | 144 |
| Comment threading | 250 | 0.5 | 0.9 | 1.0 | 112 |
| API rate limit increase | 15 | 2.0 | 0.9 | 0.25 | 108 |
| Scheduled exports | 60 | 1.0 | 0.8 | 0.5 | 96 |
| Roadmap embed on our own site | 80 | 1.5 | 0.8 | 1.0 | 96 |
| Import from a spreadsheet | 50 | 1.5 | 0.8 | 0.75 | 80 |
| Email digest for admins | 45 | 1.0 | 0.8 | 0.5 | 72 |
| Custom fields on requests | 70 | 2.0 | 0.7 | 2.0 | 49 |
| Two factor authentication | 25 | 3.0 | 0.9 | 1.5 | 45 |
| Private boards | 35 | 2.0 | 0.8 | 1.5 | 37 |
| Single sign on | 40 | 3.0 | 0.8 | 3.0 | 32 |
Every score in the last column is the formula applied to the four before it. The ordering that produces, highest first, is the RICE queue.
The two scores that are indistinguishable
Weekly digest email scores 270. Bulk status changes scores 270.
They're not tied by coincidence of rounding. They genuinely produce the same number from completely different inputs. One reaches 300 users with medium impact at 90% confidence for a person month. The other reaches 90 users with high impact at full confidence for half a month.
RICE has nothing to say about which of those you should do. Neither does any other single number framework, and the useful reading is that the ordering between two scores within about 20% of each other is noise, not information.
The practical rule is to treat the RICE queue as bands, not a ranking. Anything above 300 is the top band, 150 to 300 the second, below that the third. Inside a band, use judgement, because the arithmetic isn't resolving anything.
Where RICE misleads
Reach dominates. It's the only unbounded input. Dark mode reaches 900 users at minimal impact and still scores 225, above eight things that matter more to the people who asked.
Impact is a guess wearing a decimal point. The scale is fixed and the choice between 1 and 2 is an opinion, but it doubles the score.
Confidence multiplies rather than widens. A confidence of 0.7 lowers a score by 30%. What it actually means is that the score could be anywhere within a range, which multiplication can't express.
Effort in the denominator rewards the trivial. Tag colours tops this list. It's a quarter of a person month of work that reaches a lot of people minimally, and RICE can't tell the difference between that and something worth doing.
RICE against the other frameworks
Run over the same twenty requests, RICE's top pick is Tag colours. Sorting by raw votes gives Dark mode. Sorting by the revenue behind each request gives Single sign on, which RICE ranks twentieth of twenty.
Single sign on is first by revenue and last by RICE, because it costs three person months and reaches forty users, and RICE has no input for what those forty users pay.
That's the gap worth knowing about before adopting the framework. RICE counts people, not money. On a list where the money and the headcount point in different directions, it will follow the headcount every time.
How do you do this without a tool?
A spreadsheet with the five columns above and the formula in the sixth. It's genuinely easy and that's RICE's real advantage.
The input that takes effort is reach, because it requires either usage data or an estimate, and an estimated reach carries the whole score. That's what confidence is for, and it's also why confidence being a multiplier, not a range is a weakness.
How does this product do it?
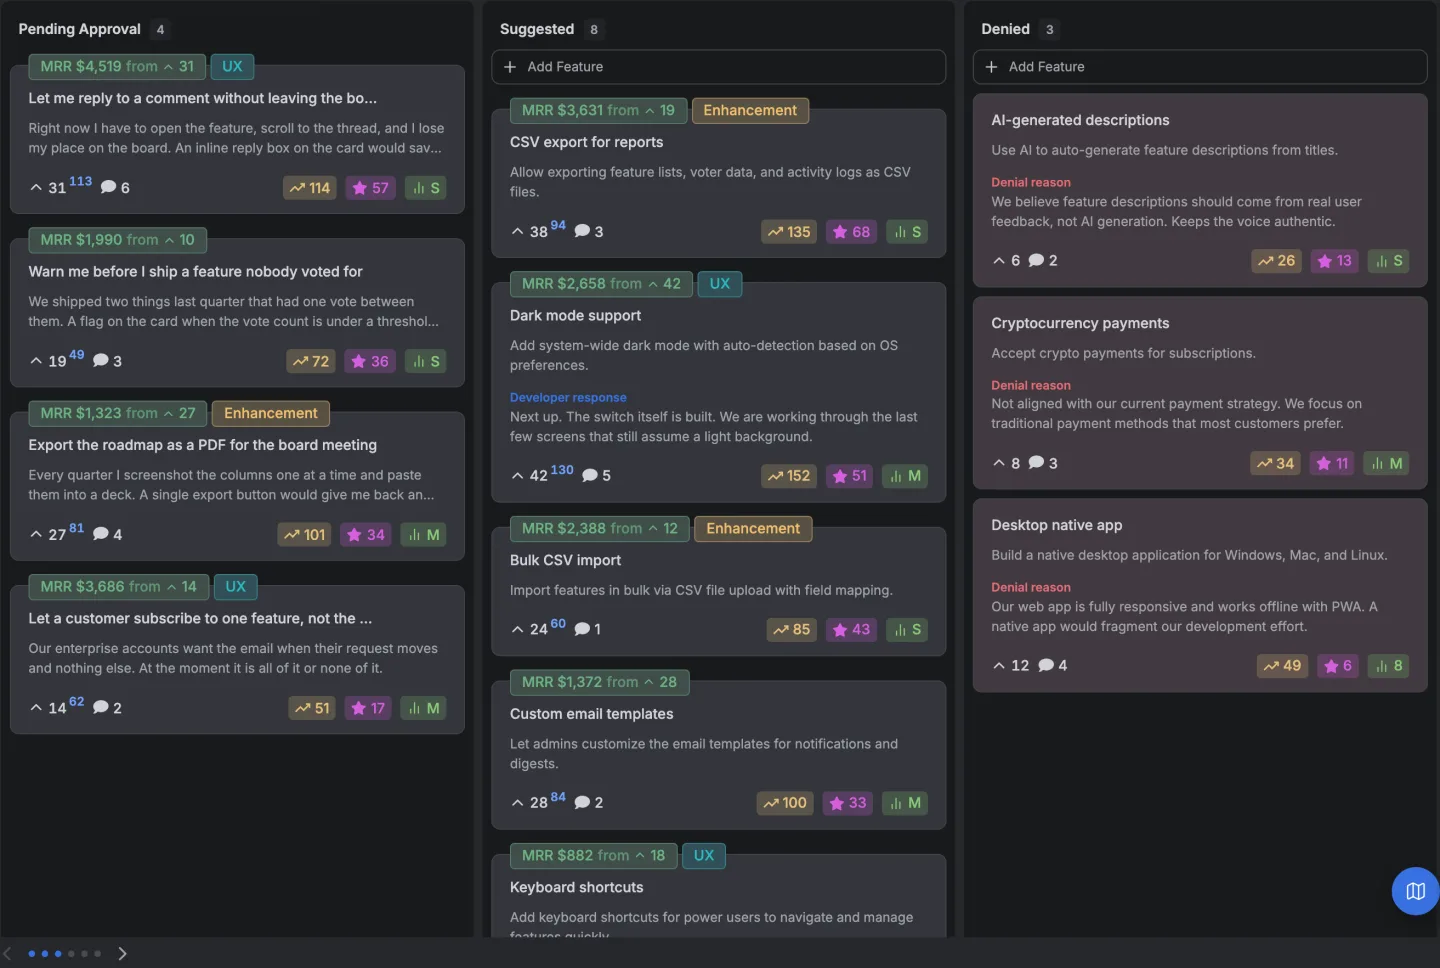
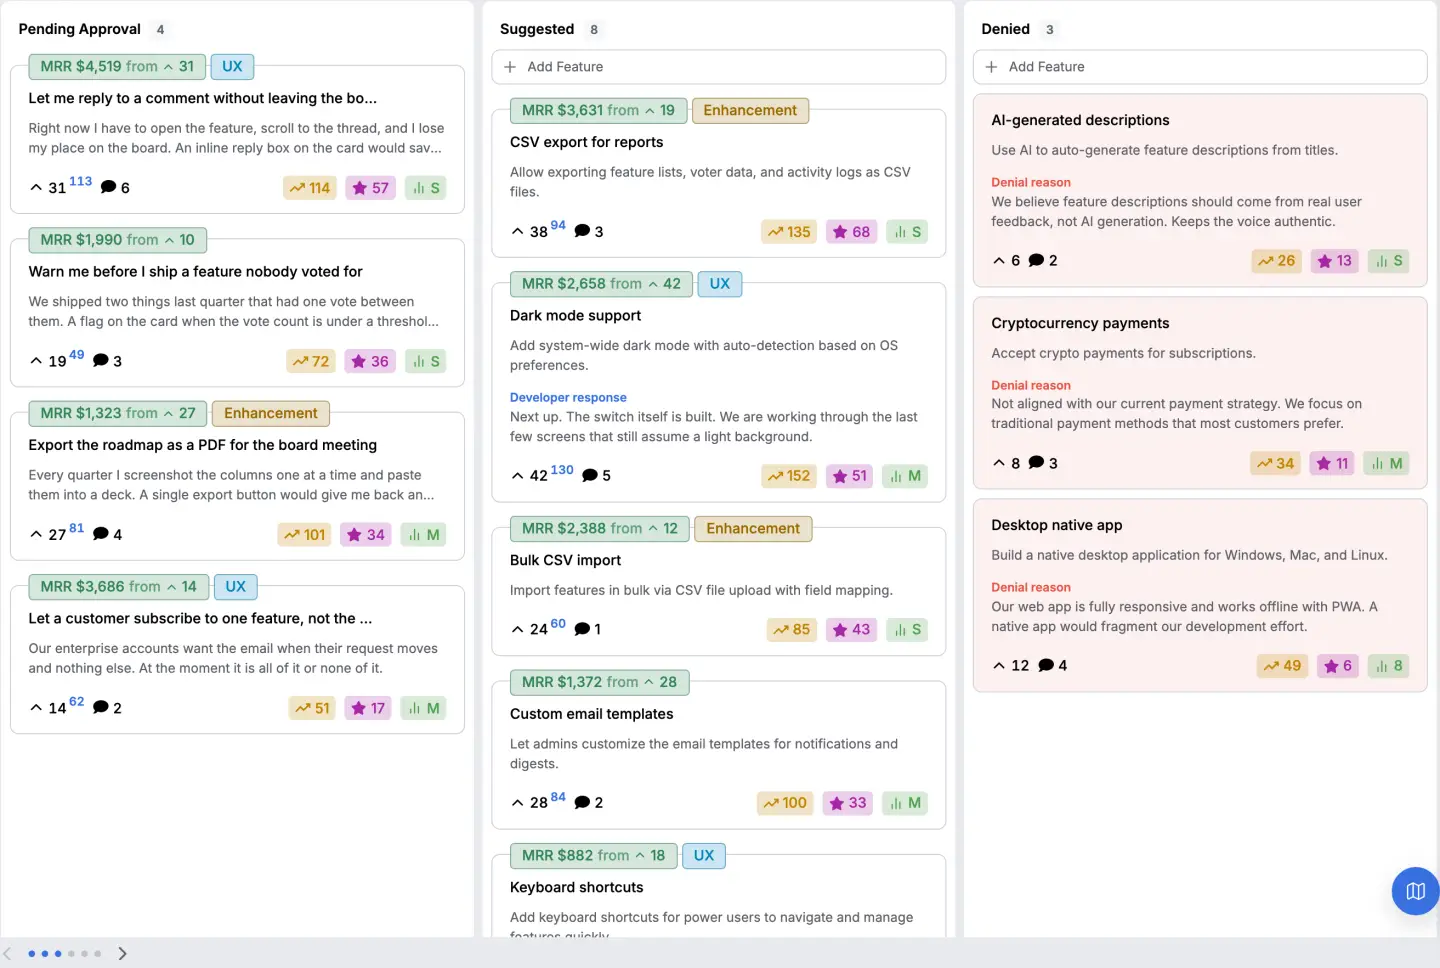
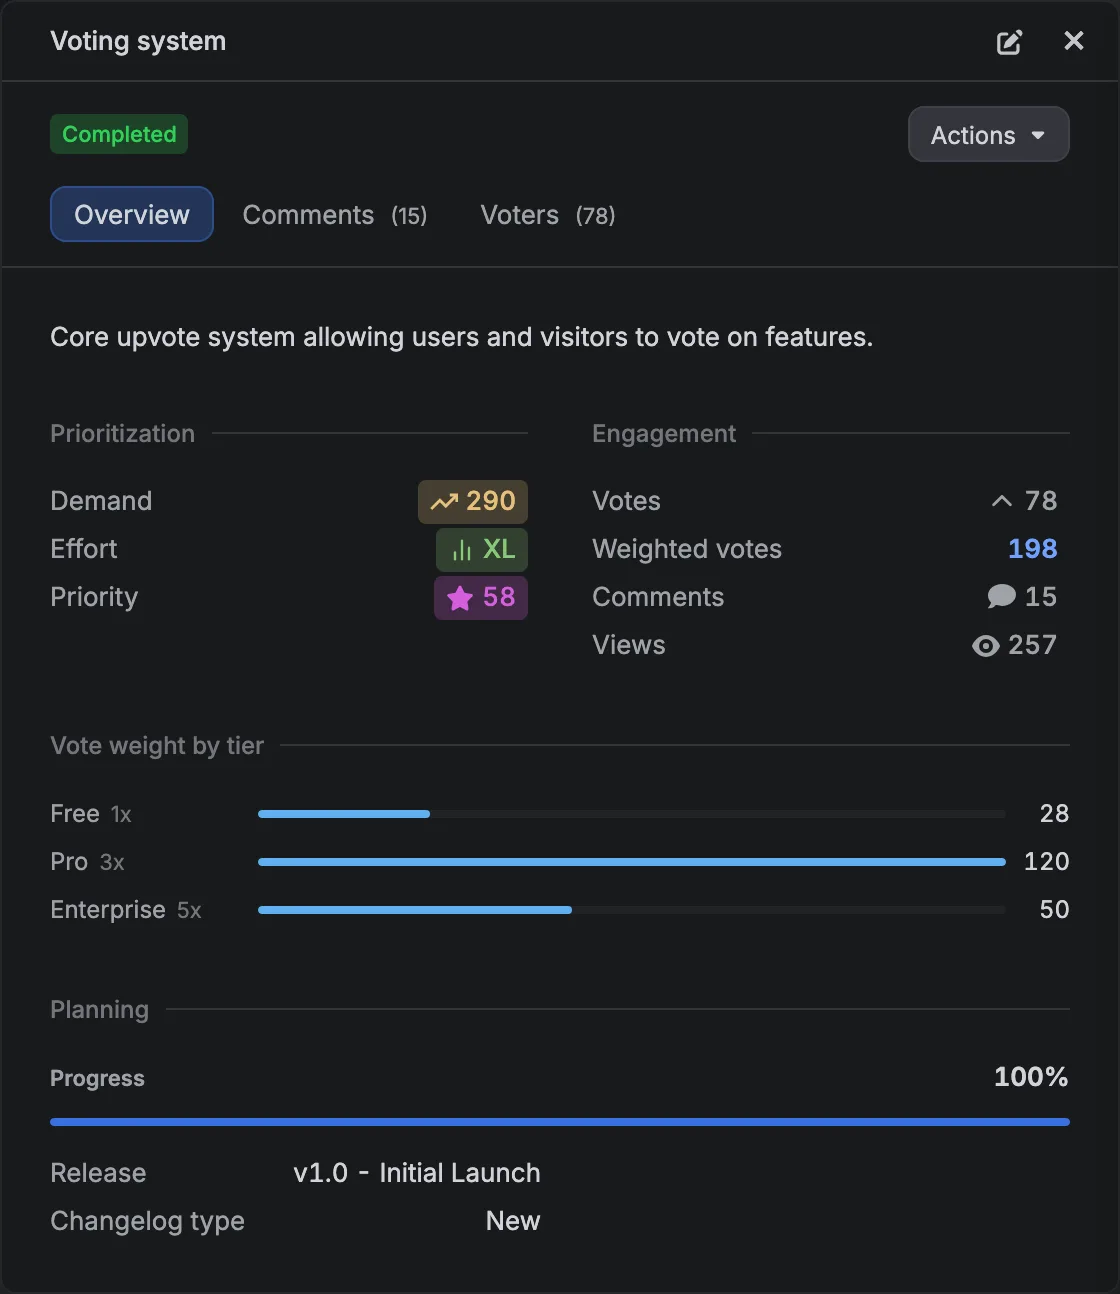
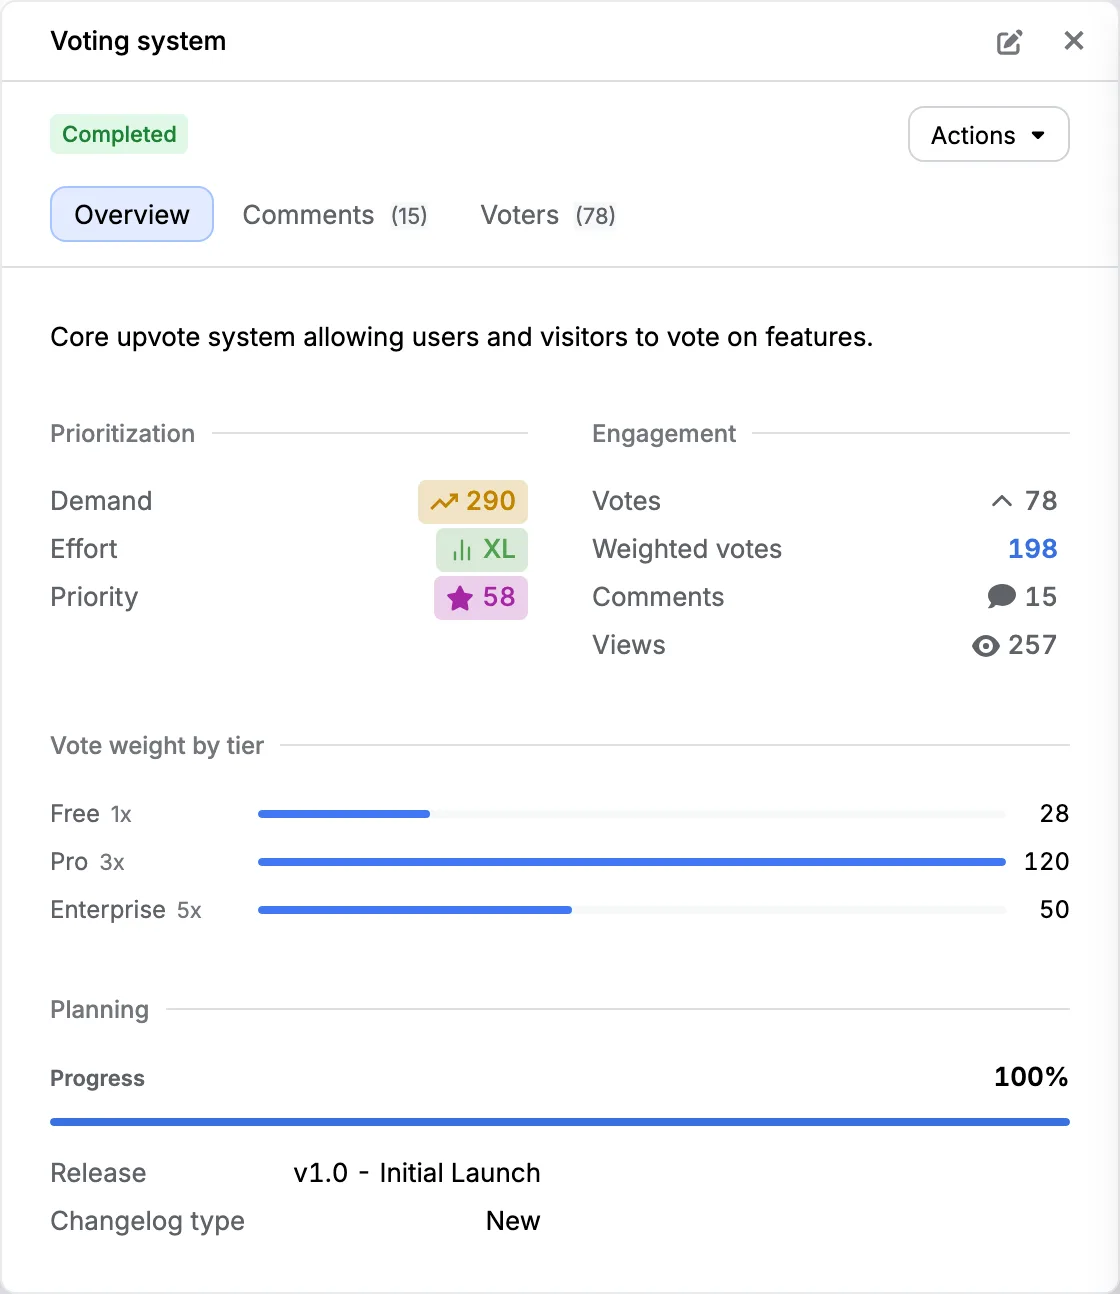
The effort estimate lives on the card, and the demand score is computed from the votes, comments and views on a request, which is the closest thing to reach that a request list can measure.
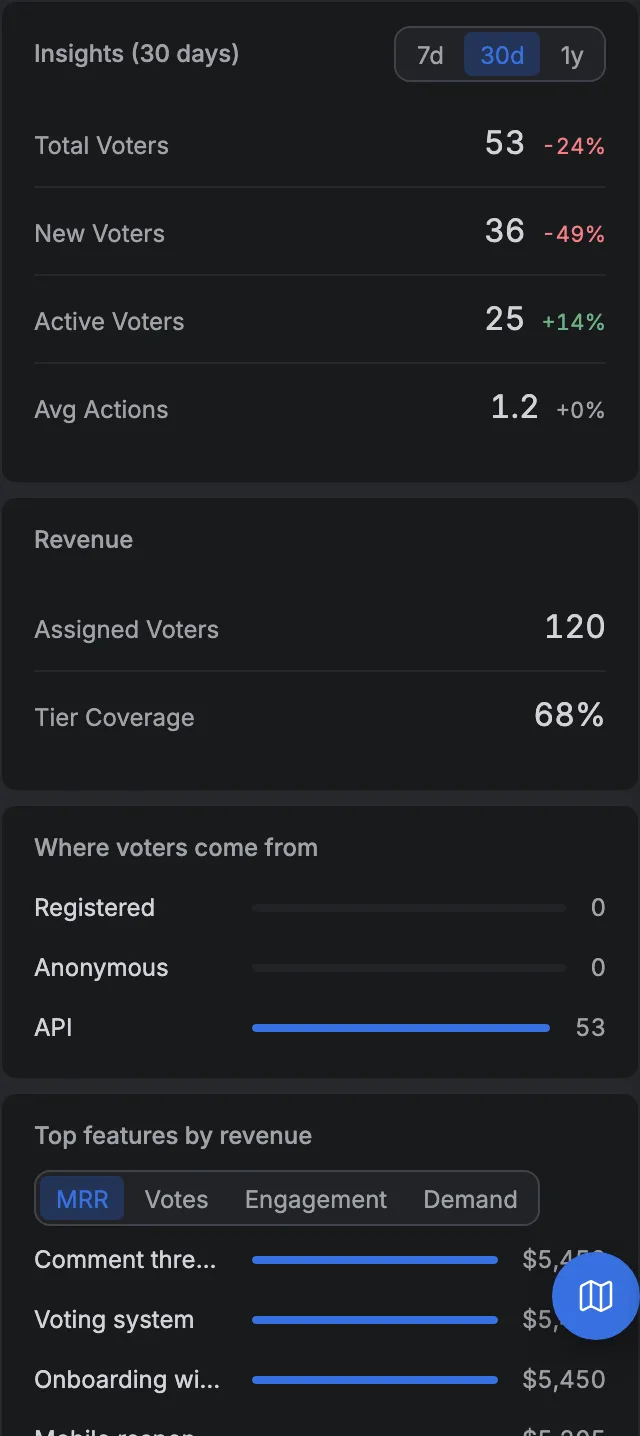
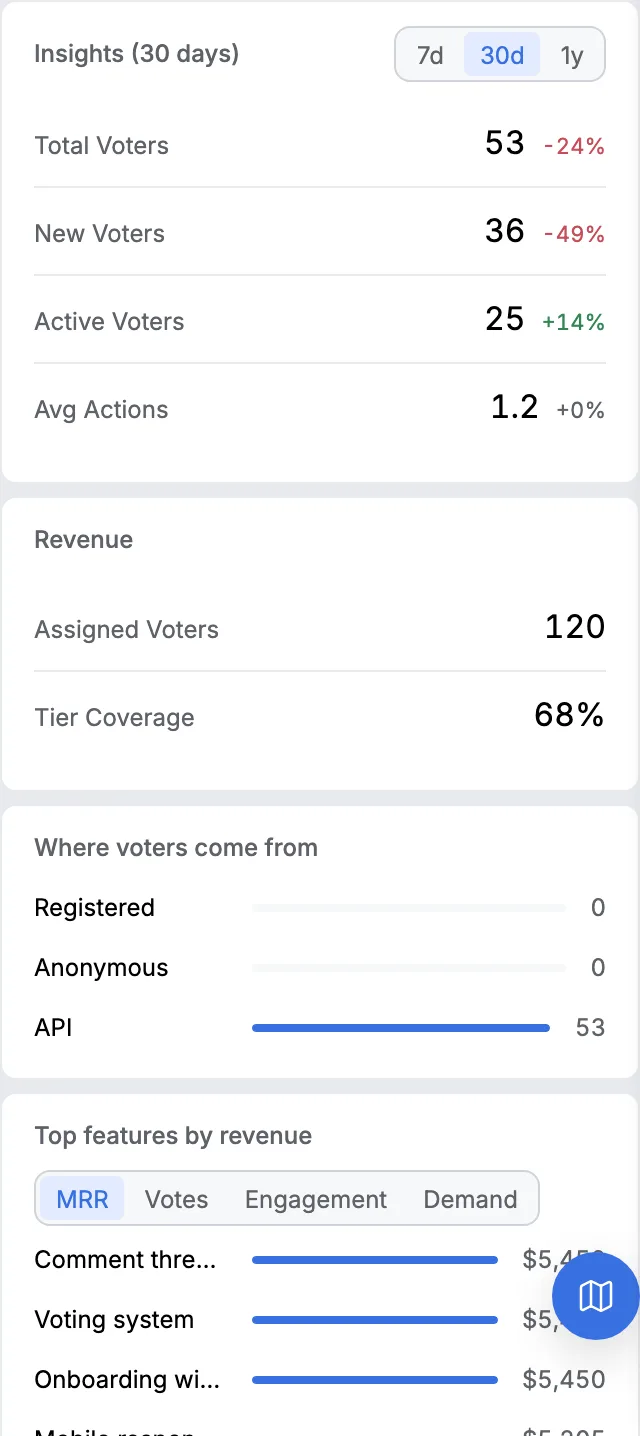
What the board adds that RICE has no term for is who voted. Each voter carries whatever you know about them, including the revenue on the account, so the weighted count is the money behind a request, not the headcount.
The board can be ordered by the priority demand and effort produce, which is RICE's shape without the estimated reach.
The revenue weighted voting page covers the weighting, and what a prioritisation framework is compares all five.
A prioritisation matrix is the version of this that needs no arithmetic at all.
14 days, a card at signup, then $9 or $39 a month.