The short version
- Nine sources, and the two most valuable are free and already happening.
- What a real request list looks like when you actually count it, rather than when it's described.
- Treating a report as a record is the mistake that spans all nine.
- Two hours a month, split in two, runs this without buying anything.
Most lists of voice of the customer examples are lists of channels. A channel isn't the interesting part. What matters is what decision the material from it can support, because two sentences arriving through different doors are worth very different amounts.
The nine below are sorted by that. The ones at the top record what somebody did. The ones at the bottom record what somebody predicts they would do.
Where does this material come from?
Nine places, and the two most valuable are free and already happening.
| Source | An example of what it produces | What it can support | What it cannot | |
|---|---|---|---|---|
| 1 | Cancellation answers | We moved to something our finance team already used | A decision to change something specific, with a price attached | Counting the people who nearly left and stayed |
| 2 | Support conversations read in a batch | Eleven people this month could not find where to change a billing address | Fixing a real problem, and knowing it is real | Prevalence, since most people who hit it never wrote |
| 3 | Onboarding drop off conversations | I stopped because I could not tell whether it imported my old data | Fixing the first ten minutes, which is where the smallest change does the most | Anything about long term customers |
| 4 | Sales objections | We cannot buy without a way to restrict who sees what | A list of what is blocking revenue right now | Whether building it would have closed the deal |
| 5 | A public request board | Forty one people want an export with revenue in a column | A counted, dated, public record of what was asked for | How badly it is wanted, or by whom, unless you know the voters |
| 6 | Renewal conversations | We nearly did not renew because reporting takes a person a day a month | Retention work, from people who stayed | Much. These are polite conversations and the truth is softened |
| 7 | Public reviews | The setup took three weeks and support was excellent | Wording. Reviews are the best source of your customers' own vocabulary | Proportions. Reviews come from the two tails |
| 8 | Interviews | I usually export it and do the rest in a spreadsheet | Understanding a workflow you did not know existed | Priority, and any number at all |
| 9 | Surveys | Sixty two per cent rated reporting below four | A trend line on a question you already knew to ask | Discovering anything you did not think to ask about |
Rows one, two and three are free, already happening, and read by nobody in particular in most companies. Rows eight and nine cost the most and sit at the bottom, which isn't an argument against doing them, only against treating their output as evidence of scale.
The fifth row is open without an account if you want to see what one holds.
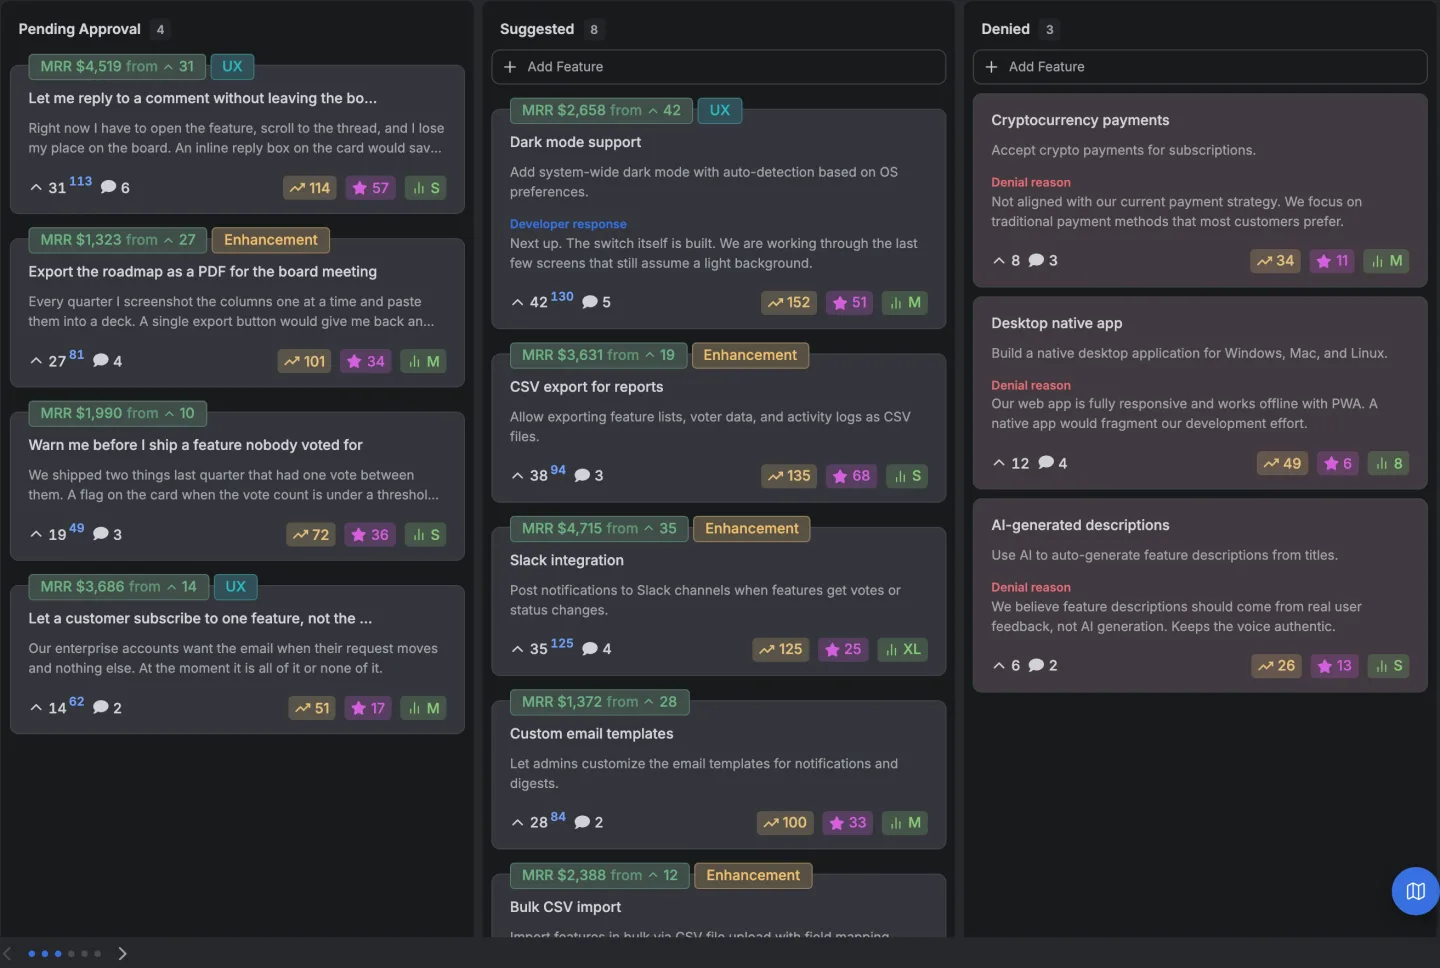
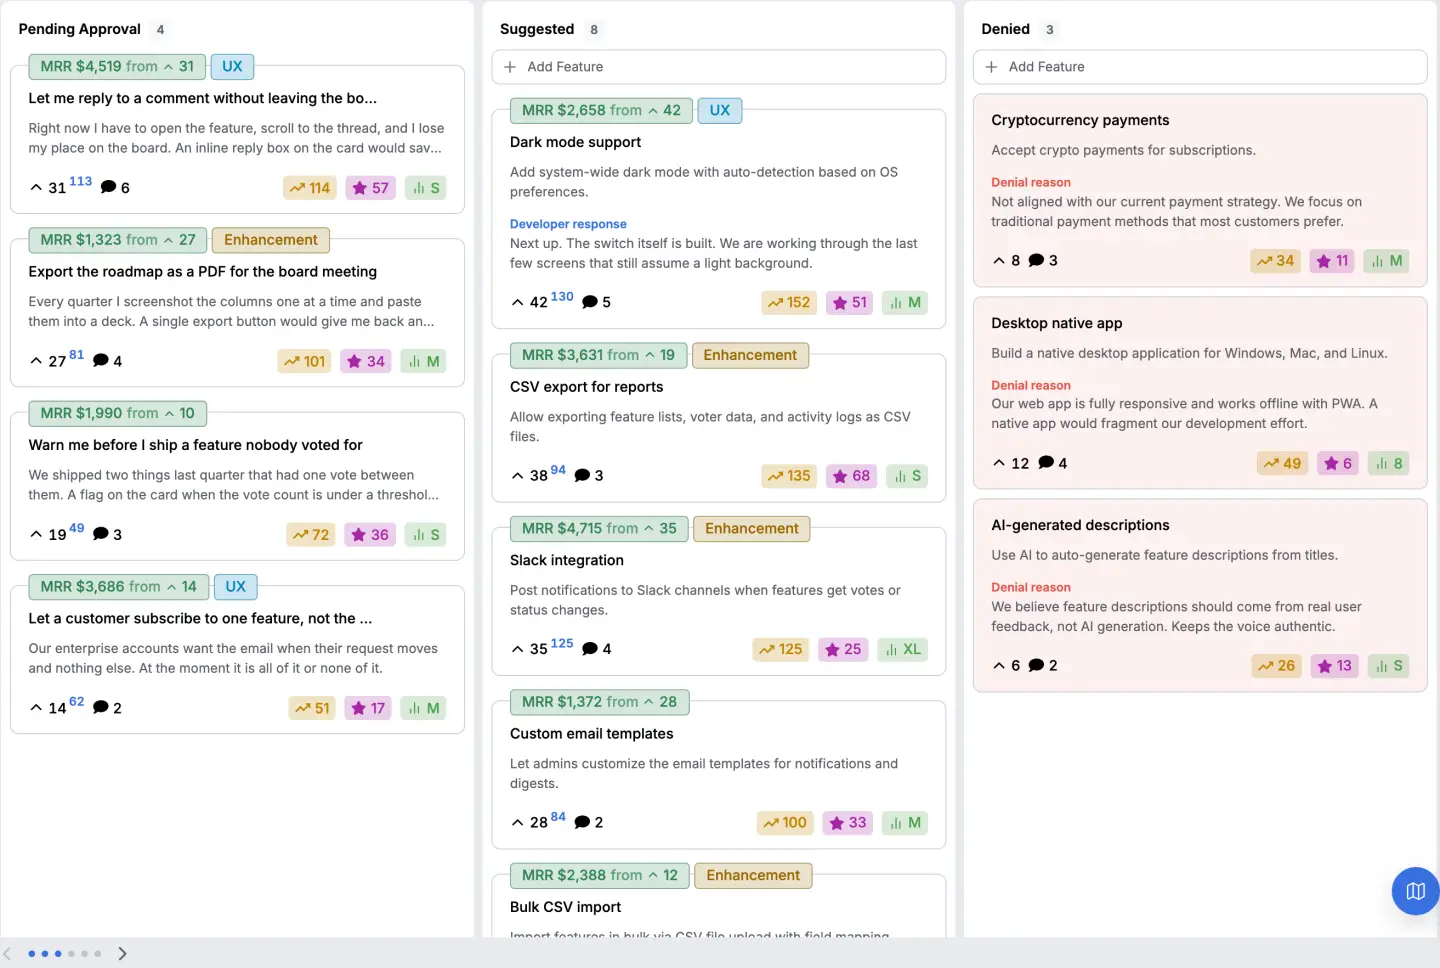
Want somewhere to put all of this? Twenty eight feedback tools, the price and the unit each one bills on, read on one day.
What a real request list looks like when you count it
Not like the examples in most articles, which is worth showing rather than asserting.
The most voted requests from thirty six public feedback boards belonging to real companies were read on 27 August 2026, giving 177 requests carrying 41,032 votes between them. Sorting them by what they ask for, by a script in this repository that prints its own working, gives this.
| Category | Requests | Share of requests | Share of votes |
|---|---|---|---|
| Nothing that fits the other categories | 72 | 41% | 37% |
| Integration with another product | 29 | 16% | 13% |
| Display, sorting or filtering | 21 | 12% | 9% |
| Editing and content control | 13 | 7% | 15% |
| Bulk or repetitive work | 12 | 7% | 9% |
| Mobile or another platform | 11 | 6% | 8% |
| Import or export | 7 | 4% | 1% |
| Notification or reminder | 6 | 3% | 4% |
| Permissions and accounts | 6 | 3% | 4% |
Three things in that table are worth more than the categories themselves.
The largest bucket is the one that fits nothing. Forty one per cent of the most voted requests across thirty six real boards don't fall into any of the eight categories under it.
Every taxonomy of feedback leaves a residue like that, and a report that shows no residue has usually had one quietly deleted.
Integration is the biggest real category at sixteen per cent of requests, and it carries a smaller share of votes than of requests, which means integrations are asked for often and wanted intensely by few. Editing and content control is the reverse, at seven per cent of requests and fifteen per cent of votes.
And one request in 177 is worded as something being broken. The most voted items on a public board are wants, not defects. Whatever your bug reports are doing, they're not doing it here.
What do people get wrong with all nine sources?
Treating a report as a record. Rows six to nine are people telling you about themselves. Rows one to five are things that happened.
Counting messages instead of people. Five messages from one engaged customer are one opinion.
Reading one at a time. The single highest value habit on this page is reading a hundred support conversations in one sitting. A problem invisible in one ticket is obvious in forty.
Collecting without answering. A channel that never replies dries up within a quarter, and it looks healthy until the day it's empty.
How do you run this without buying anything?
Two hours a month, split in two.
One hour reading support conversations in a batch, writing one line each, the situation, not the request. One hour reading every cancellation answer since the last time, verbatim, without summarising them.
That's rows one and two, which are the two most valuable sources on the page, and neither needs software. What needs software is row five, because counting the same want once and telling everybody who asked when it changes is the part that doesn't work by hand.
What our own board adds to the nine
A count that's a number of people, and an address for each of them.
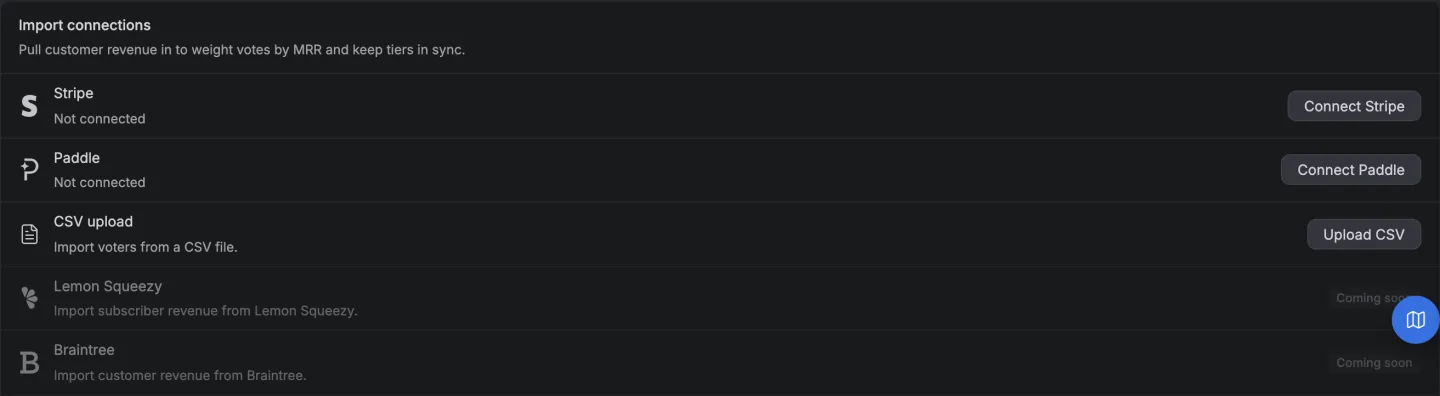
Each request carries a plain count and a count weighted by what the people voting pay, so row five's missing column, how badly and by whom, stops being missing. When a request ships, the people on that list are told without anybody keeping a record. Everything that happened sits on one timeline.
The limit is row five's limit and no feature removes it. A board hears from people who turn up, and on the median measured board the median request on page one had nine votes.
The measurement is here, how the board is wired is written up here, and what the phrase voice of the customer is standing in for has its own page.
14 days, a card at signup, then $9 or $39 a month.